Overview
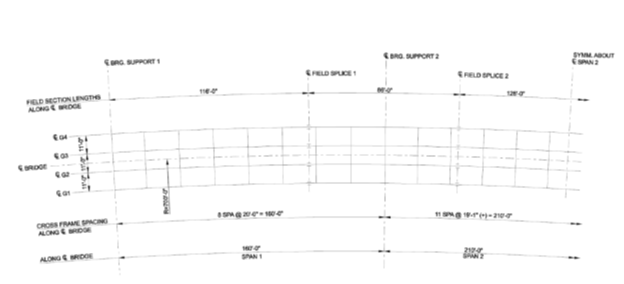
The effects of the curvature sometimes can not be ignored in the design process. The following example uses a three-span continuous curved composite steel bridge. You will see a comparison result of the straight beam and the curved beam in this article. It will show you how the curvature may influence the design.

The discussion will be provided for the exterior girder G4. The moment of inertia is assumed to be constant along the bridge, and the ratio of EI/GJ is assumed constant as 300.
The span length ratio is 210/160=1.3125; the side span is 160/700=0.2286, rad=13.10°; and the center span is 210/700=0.3000, rad=17.19°.

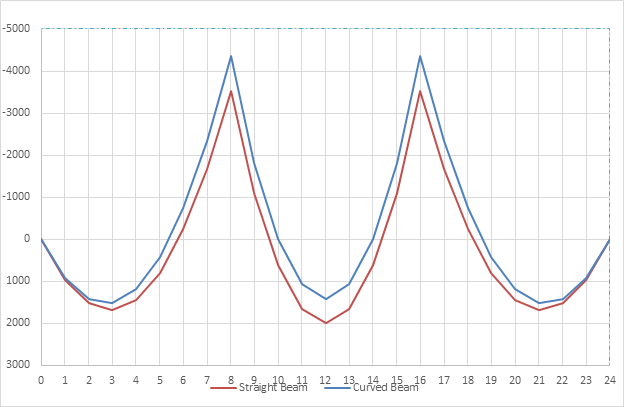
Figure 2 shows the complete unit load moment diagram for curved and straight beams with the same span length. At the 3/8 point (side span), the curved girder moment is around 90% of straight girder moments. At the pier location, this ratio isapproximately 124%, at the center span 72%. Even with this medium-span bridge, the moment difference is around 30%.
.png?width=624&height=407&name=Figure%203%20Bending%20Moment%20due%20to%20Full%20Unit%20Load%2c%20with%20MIDAS%20Results%20(8%20divisions%20span).png)
Figure 3 shows MIDAS results with linear beam elements but curved geometry with eight divisions in each span. The moment distribution is close to exact curved beam results, and the difference is around 2%.

Figure 4 shows the shear force comparison, and the maximum difference is around 6%.
.png?width=624&height=409&name=Figure%205%20Moment%20Influence%20Line%20at%203%208%20(End%20Span).png)
Figure 5 shows the moment influence line at 3/8 point (side span). The shape itself is similar but the maximum difference is around 33% at the 11/8 point.
.png?width=624&height=409&name=Figure%206%20Moment%20Influence%20Line%20at%208%208%20(End%20Span).png)
Figure 6 shows the moment influence line at the pier location. The shape itself is similar but the maximum difference is around 32% at 11/8 point.
.png?width=624&height=409&name=Figure%207%20Moment%20Influence%20Line%20at%2012%208%20(Center%20Span).png)
Figure 7 shows the moment influence line at the center-span center location. The shape itself is similar but the maximum difference is around 15% at 12/8 point.
Conclusion
Even in the medium-span curved bridges, the effect of the curvature is more than 30% and can not be ignored in the design. Not many programs can handle this problem, and the users have to understand the limits of each program and apply their engineering judgment on how to proceed.

He is a Senior Supervising Engineer with a high level of expertise in the design and analysis of suspension bridges. He has a solid fundamental understanding of structures and can apply his knowledge exceptionally well to the design and analysis of highly complex structures. He is also a strong communicator, able to identify and distill the key information that is relevant to the task at hand and present it in a clear and quickly understandable manner.


![Design and Practical Examples of Baseplates and Anchor Rods [sample download]](https://2495902.fs1.hubspotusercontent-na1.net/hubfs/2495902/%EC%8D%B8%EB%84%A4%EC%9D%BC22.png)
![Understanding Drafting Standards [ Drawing download ]](https://2495902.fs1.hubspotusercontent-na1.net/hubfs/2495902/%EC%8D%B8%EB%84%A4%EC%9D%BC24.png)
![Key Changes in ACI 318-19: A New Standard for Structural Design [ PDF download]](https://2495902.fs1.hubspotusercontent-na1.net/hubfs/2495902/%EC%8D%B8%EB%84%A4%EC%9D%BC21-1.png)
![Design and Practical Examples of Lug design(ASME BTH-1) [sample download]](https://2495902.fs1.hubspotusercontent-na1.net/hubfs/2495902/%EC%8D%B8%EB%84%A4%EC%9D%BC20-1.png)


